Experimental Study on Erosion Characteristics of Three-dimensional Geonet Protective Slope
Abstract: In order to reveal the erosion law of slope protection of 3D geonets, the indoor simulated water flushing test was used to quantitatively study different slopes (5°, 10°, 15°, 20°, 25°, 30°) and different flow rates (1 m3). /h, 1.5 m3/h, 2 m3/h), the erosion process and erosion characteristics of the 3D geonet protective slope. The results show that: (1) the cumulative erosion increases with the increase of slope and flow, and the erosion obtained in the first 10 minutes of erosion accounts for about 70% of the total erosion, while the sediment flow rate at the end of the scouring is only (1) With the increase of slope, the contribution rate of cumulative erosion increases, and the flow rate plays a leading role in cumulative erosion. Under the condition of large flow erosion, the flow rate is cumulatively erosion. The contribution rate is more significant than when the flow rate is small; (3) the power relationship between the cumulative erosion amount and the slope is positively correlated, and the correlation is significant; (4) the slope flow of the three-dimensional geonet protection slope is turbulent, and the cumulative erosion amount and The relationship of the Reynolds coefficient can be expressed as M = 0.186 Re 0.672, and the correlation coefficient R2 = 0.9429.
Keywords: three-dimensional geonet mat; slope flow; soil erosion
The three-dimensional geonet protective slope is a new type of ecological slope protection formed by combining three-dimensional geonet mats with vegetation. The upper and lower layers of the mesh mat interact with the soil, and the friction generated can improve the stability of the slope. The mesh layer of the mesh mat fixes the planting soil and plant seeds on the surface of the slope to provide the necessary conditions for the growth of the vegetation. When scoured by the water flow, the flow direction of the slope flow is continuously changed due to the undulations on the upper surface of the mesh mat, and the energy loss along the path is gradually increased, which plays a good energy dissipation effect and reduces the erosion of the water surface on the slope surface. The current engineering construction has been more and more widely used.
At home and abroad, we have carried out more comprehensive and in-depth research on slope soil erosion, and have obtained rich and valuable experience and achievements [1-11], in order to study the three-dimensional geonet protection slope erosion and sediment production process from the aspect of the hydrodynamic process. Foundation. In recent years, China’s research on ecological slope protection has developed at a relatively fast pace and has achieved a series of useful research results. Xiao Henglin et al [12] systematically analyzed the design mechanical indexes of 3D geonets, systematically studied the strength formula of mesh mats from fluid mechanics, engineering mechanics, etc., and obtained reasonable mats through the erosion test under different slopes. The opening size solves the design index problem of 3D geonet mat to a certain extent, and puts forward the construction procedure and technical points of 3D geonet mat grass planting slope protection technology; Wang Guangyue et al [13] used limit equilibrium method to establish protection under rainfall conditions. The slope stability analysis model is used to analyze the influence of soil moisture content, slope angle, rivet spacing, cell slope length, slope flushing and cell death on the stability of the slope; Liu Xiaolu et al [14] The requirements of slope on the mat, the selection of grass species in different areas and the conservation of environmental protection system have made a comprehensive analysis of the factors affecting the slope protection effect of 3D geonets; Chen Renhao et al [15] analyzed the slope angle and water flow in detail. The effect of sanding amount and scouring time on the waterproof scouring performance of the three-dimensional soil-laying mat, and then the slope angle, the scouring time, and the sanding Factors such as volume and water flow have been studied comprehensively on the effects of various three-dimensional geonet mats. However, the above research mainly focuses on the evaluation of environmental impacts of slope stability, soil and water conservation, conservation and soil erosion, while ignoring slope erosion. In view of this, this paper focuses on the structural characteristics of the 3D geonet slope, through the indoor water flushing simulation test, reveals the soil erosion process of the 3D geonet protection slope, and clarifies the erosion dynamics of the 3D geonet slope under different slopes and different flow conditions. The relationship between erosion and sediment production is to develop the erosion characteristics and laws of this kind of special slope flow and provide scientific basis and technical support for the scientific design of 3D geonet protection slope.
1 Test equipment and scheme design
The test uses a 5.6 m × 1.0 m × 0.5 m self-made plexiglass sink and is equipped with a rail-type hydraulic gradient system so that the slope of the tank can be changed from 0 ° to 45 °. The flushing water supply system consists of a reservoir, a fixed head water tank, and a steady flow tank. The steady flow tank is arranged at the top of the water tank, and a 20 cm high non-porous steel baffle, a 50 cm high hollowed-hole steel baffle and a 50 cm high hollowed-hole steel baffle are arranged in order to eliminate Partial turbulence of the water flow. The flush flow is read directly from the electromagnetic flowmeter and can be controlled by the valve block.
The test uses a three-dimensional geonet mat of type EM3 with a thickness of 18 mm, a width of 1 m, a tensile load of more than 3.2 k N/m, and an elongation of 70%. In order to restore the actual character of the soil slope and ensure that the three-dimensional geonet mat is on the same level, the 15 cm thick soil is layered in the tank before the laying of the mat and leveled with water. When laying, ensure that the mesh mat is straight and close to the slope, and a row of U-shaped anchors are placed every 50 cm, each row is 3, equidistantly distributed. After fixing the mat, evenly cover the soil, and the amount of soil per square meter is controlled by weight. Use a wooden strip to scrape the soil and fill it with a net mat net bag. After compaction, remove the floating soil and level the slope. The test uses the sandy silt in the Changqing area of Jinan. The maximum dry density of the soil is 1.853 g/cm3 and the optimum moisture content is 13.8%. The particle gradation of the test silt was measured by a densitometer method, and the obtained data are shown in Table 1.
Table 1 Particle grading of test sandy silt
In the test, the flow rate of the slope flow was measured by potassium permanganate tracer method, and the flow rate was measured every 2 minutes. The method of measuring the flow rate of the three values on the slope surface, the middle and the bottom was used. In order to determine the sand flow rate of the slope flow, about 500 ml of the hydrophobic sample was taken every 1 min, the volume was accurately measured by the measuring cylinder, the mass was weighed by an electronic balance, and finally, the sand content of each sample was converted by the displacement method. In the process of scouring, it is also necessary to measure the width of the surface of the slope and observe the exposure of the three-dimensional geonet mat. After the scouring, the scouring depth is determined.
The test used a total of 3 flushing flow rates of 1,1.5,2 m3/h and 5 gradients of 5°, 10°, 15°, 20°, 25°, 30°, and a total of 18 sets of tests were performed. Scour for 30 min.
2 Results and analysis
2.1 Basic characteristics of slope flow erosion
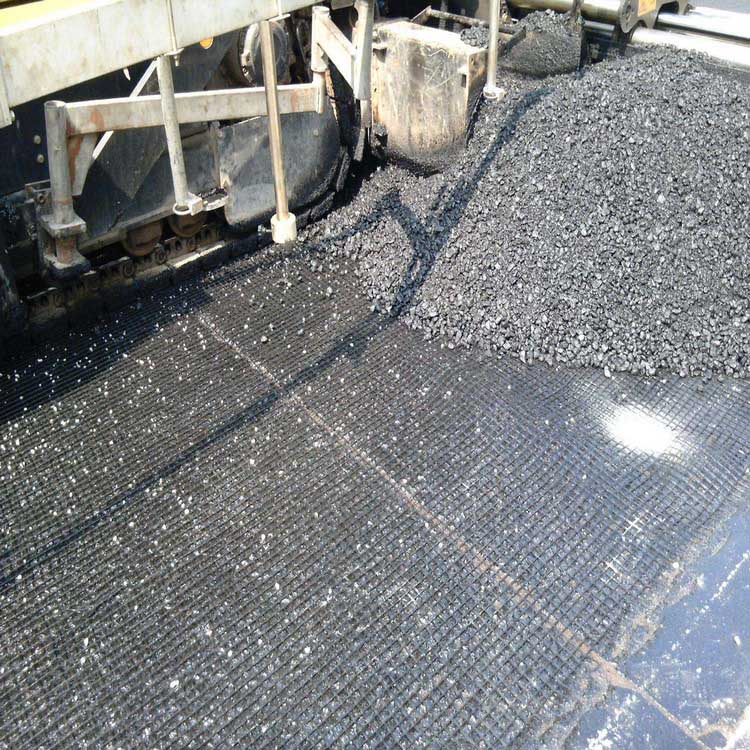
Figure 1 shows the slope condition at the beginning and end of the three-dimensional geonet protection slope. Due to the role of the three-dimensional geonet mat, the slope exhibits special soil erosion characteristics. In the initial stage of scouring, due to the existence of a certain amount of floating soil on the slope, the sediment particles are easily started to be transported, resulting in the initial stage of scouring, the sedimentation rate of the slope flow is large, and the slope surface is relatively flat, and the three-dimensional mesh mat is barely exposed. On the slope. The slope flow is less resistant and has more energy for eroding and transporting the sloped soil. With the scouring of the slope flow, the soil particles in the mesh mat are difficult to be punched out due to the restraint of the mesh mat. Although the sedimentation rate of the slope flow is large at the initial stage of scouring, there is a sharp drop. As time goes by, the soil outside the 3D geonet mat is further flowed and transported by the slope, which causes the mesh cushion to be almost completely exposed on the slope surface. The slope flow resistance coefficient is increasing and the erosion difficulty is constant. Enhanced. At the end of the scouring, almost all the soil outside the network in the basin has been transported. The energy of any slope flow under the same flow conditions and different slope conditions can not make most of the soil in the net bag overcome the net bag binding. It is carried, so the sediment rate during this period is extremely small. The sediment flow rate of the slope flow sample obtained in the last 5 minutes of scouring is only 0.01-0.04 g/cm3, and most of them are 0.02 g/cm3. At this time, the naked eye can hardly recognize whether the slope flow is sandy.
2.2 The law of cumulative erosion
The sediment concentration was measured under different flow rates and different slopes, and the cumulative sediment concentration of different slopes under three flow rates was calculated. It can be seen from Fig. 2 that under three test flow conditions, the cumulative erosion of different slopes is accompanied by the scouring. It is increasing and has a relatively consistent law of change: in the first 7 minutes of scouring, the cumulative erosion increases rapidly; as the scouring progresses, the cumulative erosion increases gradually; at the end of the scouring, the sand content of the slope flow is almost Zero, the cumulative erosion increase is extremely slow; at the same flow rate, the cumulative amount of sediment erosion increases with the slope at the same time.
Figure 1 Scouring initial and final slope flow
Fig. 2 Variation of cumulative erosion amount with time under different flow rates and different slope conditions
2.3 The proportion of cumulative erosion in each scouring period
It can be seen from Table 2 that under the test conditions of different slopes and flow rates, the cumulative erosion in the first 10 min accounts for about 70% of the total erosion. At the initial stage of scouring, under the test conditions of the slope of 10° and flow rate of 2 m3/h, the cumulative erosion accounted for 78.51% of the total erosion, which is the corresponding maximum value in the whole test; the slope is 5° and the flow rate is 1.5 m3. Under the test conditions of /h, the value is 61.33%, which is the corresponding minimum value in the whole test. The cumulative erosion within 11 to 20 minutes accounts for about 20% of the total erosion. Under the test conditions of slope 5 ° and a flow rate of 1.5 m3/h, the value is 22.80%, which is the corresponding maximum value in the whole test; under the test condition of slope 10 ° and flow rate 2 m3/h, The value is only 12.13%, which is the corresponding minimum value in the whole experiment. The cumulative erosion within 21 to 30 minutes accounts for about 10% of the total erosion. The analysis reason is that: at the initial stage of scouring, the surface of the slope has more erosive soil particles, which are easier to be washed by the water flow, so that the cumulative erosion amount increases rapidly. With the increase of scouring duration, most of the soil particles that are easily washed away on the slope surface have been Erosion, the growth rate of the cumulative erosion amount is relatively slower than that of the initial stage. The soil particles washed out by the slope surface mainly come from the concave part outside the 3D geonet mat; at the end of the scouring period, most of the soil particles outside the 3D geonet mat have been It is eroded, and the soil particles in the net bag are not easily washed out by the water flow due to the wrapping effect of the mesh mat, resulting in a slow increase in the cumulative erosion amount. It is further explained that the existence of the three-dimensional geonet blocks the erosion of the slope flow to the slope in the surface erosion stage, so that the corresponding erosion amount per minute decreases with the progress of the scouring, and tends to be stable at the end of the scouring.
Table 2 Cumulative erosion amount in each time period
2.4 Contribution rate of erosion flow and slope to slope erosion and sediment yield
Changes in slope and flow rate lead to different erosion effects, and the effects of the two on the erosion amount are quantified by the method of calculating the contribution rate [16]. The cumulative erosion amount of each slope and flow rate under the action of 1 m3/h and 1.5 m3/h flushing flow and 1 m3/h and 2 m3/h flushing flow with 1 m3/h as the flow reference and 5° as the slope reference respectively The contribution rate is analyzed. The specific calculation methods are shown in Table 3 and Table 4.
It can be seen from Table 3 and Table 4 that when the flow rate increases from 1 m3/h to 1.5 m3/h, the contribution rate of slope increase to cumulative erosion generally increases, but the flow rate plays a leading role in the change of cumulative erosion. The minimum contribution rate of flow change to cumulative erosion change is 51.81%; when the flow increases from 1 m3/h to 2 m3/h, there is still an increase in the contribution rate of cumulative erosion as the slope increases. The law that plays a leading role in the cumulative erosion amount and the contribution rate of the flow rate to the cumulative erosion amount is more significant than when the flow rate is small. When the flow rate increases from 1 m3/h to 2 m3/h, the flow rate contributes the least to the cumulative erosion amount. The value reached 69.03%. The reason for the analysis is that due to the slope protection effect of the three-dimensional geonet mat, the impact of the slope on the cumulative erosion is greatly reduced when the slope encounters erosion. Most of the sediment that can be carried by the slope flow is the slope soil on the surface of the slope and outside the three-dimensional geonet mat. Although the slope potential energy that can be converted into kinetic energy increases with the increase of the slope, the increase is not enough to dominate the change of cumulative erosion. When the flushing flow changes, the runoff of the slope increases sharply, the water depth of the slope increases and the turbulence becomes stronger, and the shearing force and erosion of the slope surface on the slope surface become larger. For the slope surface which is washed by the slope flow and the soil, stability is deteriorated, the erosion effect of the flow is increased, and the effect of the slope change on the cumulative erosion amount is concealed.
Table 3 Contribution rate of slope and erosion flow to erosion under the test conditions of the flow rate of 1 m3/h and 1.5 m3/h
Note: a5 is the cumulative erosion amount under the test condition of flow rate 1 m3/h and slope 5°, which is the benchmark for calculating the contribution rate; ai is the flushing intensity of flow 1 m3/h, cumulative erosion of each slope; Aj is 1.5, 2 The cumulative erosion amount of each slope under m3/h flow rate; Aj-a5 is the increment of cumulative erosion caused by the increase of slope and erosion flow; ai-a5 is the increment of cumulative erosion caused by the increase of slope; Aj- Ai is the increment of cumulative erosion caused by the increase of flushing flow; ai-a5/Aj-a5 is the contribution rate of slope to cumulative erosion; Aj-ai/Aj-a5: the contribution rate of flow to cumulative erosion; i = 5, 10, 15, 20, 25, 30; j = 5, 10, 15, 20, 25, 30, the same table below.
Table 4 Contribution rate of slope and erosion flow to erosion under the test conditions of 1 m3/h and 2 m3/h
2.5 Relationship between cumulative erosion and slope
According to the data obtained from the experiment, the relationship between the cumulative erosion of the three-dimensional geonet protective slope and the slope is obtained. It can be seen from Figure 3 that slope is one of the main factors affecting slope erosion. In the case of slope flow, when the slope is small, as the slope increases, the water depth of the slope decreases and the flow velocity increases, and the interaction between the water flow and the slope of the sediment belt increases. Therefore, the increase of the slope not only increases the slope potential energy into a part of the kinetic energy but also increases the effective shear stress of the slope flow and increases the erosion amount. For the flushing flow of 1,1.5,2 m3/h, the slopes and the corresponding cumulative erosion amount are simulated. The results show that the cumulative erosion is positively related to the hydraulic gradient, that is, the cumulative erosion increases with the slope. Large and increased, the fitting results are shown in Table 5.
2.6 Relationship between cumulative erosion and Reynolds coefficient
The flow regime of the slope flow is analyzed by the flow around the Reynolds coefficient including the slope roughness. The formula is
Where: u is the average flow velocity (m/s) of the slope flow; R is the absolute roughness (m) of the slope, and the scouring depth is taken in this test; ν is the moving viscosity coefficient (cm2/s).
Table 5 Fitting results of the relationship between cumulative erosion and slope
Where: J is the slope of the slope.
Figure 4 shows the variation of the cumulative erosion of the slope with the Reynolds coefficient. It can be seen that the Reynolds coefficient varies from 1 198 to 10 529 in the test, which is greater than the critical Reynolds coefficient of 500, that is, the three-dimensional geonet protective slope. The slope flow is turbulent. When the flow state is turbulent, the general fluid flow rate is large, and there are many vortices in the flow field, and the flow line is almost unrecognizable. The larger the Reynolds coefficient, the greater the additional shear stress caused by turbulence, and the stronger the erosion of the slope flow on the slope. The power function fitting of the cumulative erosion amount and the Reynolds coefficient gives M=0186Re0.672 and the correlation coefficient R2=0.9429, as shown in Fig. 4. This shows that the slope flow state has a significant impact on the cumulative erosion of the slope.
Figure 3 Relationship between cumulative erosion and slope
Figure 4 Relationship between cumulative erosion and Reynolds coefficient
3 Conclusion
(1) In the initial stage of scouring, the slope flow contains a large amount of sediment. During the scouring process, the sediment content decreased sharply and remained stable at the end of the scouring period. At any slope and any flow rate, the sediment concentration at the end of the scouring period fluctuates from 0.01 to 0.04 g/cm3.
(2) The cumulative erosion amount increases with the increase of slope and flow rate, and the erosion amount obtained in the first 10 minutes of erosion accounts for about 70% of the total erosion.
(3) In the process of slope erosion and sediment yield, as the flow rate and slope increase, the contribution rate of cumulative erosion increases, but the flow rate plays a leading role in the cumulative erosion, especially when the flow is large.
(4) The power function relationship of cumulative erosion amount and the slope is positively correlated, and the correlation is significant; the slope flow of 3D geonet protective slope is turbulent, and the relationship between cumulative erosion and Reynolds coefficient can be expressed as M=0186Re0.672, correlation coefficient R2 = 0.9429.
(5) The variation of particle distribution and particle distribution of eroded soil with time requires a series of related experimental studies.